How to Read Forex Charts: A Comprehensive Guide
Understanding how to read Forex charts is crucial for any trader looking to succeed in the foreign exchange market. Forex charts provide valuable insights into currency price movements, helping traders make informed decisions. In this article, we will break down the essentials of reading Forex charts, focusing on key elements like chart types, timeframes, and technical indicators.
What is a Forex Chart?
A Forex chart is a graphical representation of the price movements of a currency pair over a specified period. These charts help traders identify trends, patterns, and potential entry and exit points for trades. There are various types of Forex charts, each serving different purposes.
Types of Forex Charts
1. Line Charts
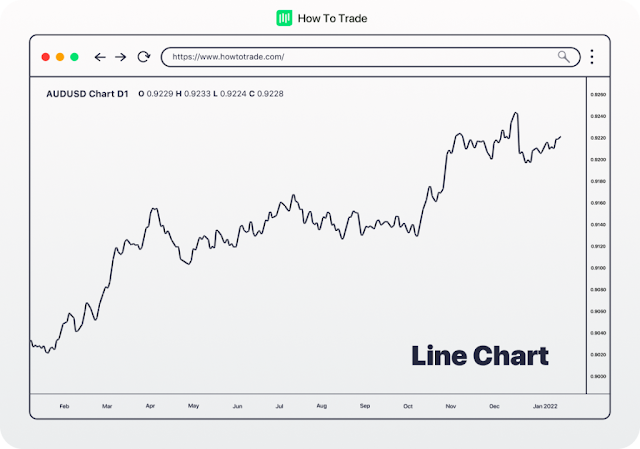
Line charts are the simplest type of Forex charts, displaying the closing prices of a currency pair over a period. This type of chart connects the closing prices with a continuous line, making it easy to identify overall trends.
- Benefits:
- Easy to read
- Ideal for identifying long-term trends
- Drawbacks:
- Lacks detailed information on price movements within the period
2. Bar Charts
Bar charts provide more detailed information compared to line charts. Each bar represents a specific timeframe and shows the opening, high, low, and closing prices (OHLC) of the currency pair.
- Benefits:
- Detailed price information
- Useful for analyzing market volatility
- Drawbacks:
- Can be complex for beginners
3. Candlestick Charts
Candlestick charts are the most popular among Forex traders due to their detailed and visually appealing format. Each candlestick represents the OHLC data for a specific timeframe and comes in different colors to indicate price movements.
- Benefits:
- Easy to interpret
- Highlights market sentiment
- Useful for identifying patterns and trends
- Drawbacks:
- Can be overwhelming for beginners
Key Elements of Forex Charts
1. Timeframes
Forex charts can be viewed over various timeframes, ranging from one minute to one month. The choice of timeframe depends on your trading strategy:
- Short-term traders often use 1-minute to 15-minute charts.
- Medium-term traders prefer 1-hour to 4-hour charts.
- Long-term traders typically use daily, weekly, or monthly charts.
2. Support and Resistance Levels
Support and resistance levels are horizontal lines on a Forex chart that indicate where the price tends to stop and reverse. Support levels act as a floor, preventing the price from falling further, while resistance levels act as a ceiling, preventing the price from rising further.
Identifying Support and Resistance:
- Look for historical price points where the currency pair reversed direction.
- Use technical tools like moving averages and trendlines.
3. Technical Indicators
Technical indicators are mathematical calculations based on the price, volume, or open interest of a currency pair. They help traders make sense of price movements and forecast future trends.
Popular Technical Indicators:
- Moving Averages: Smooth out price data to identify trends.
- Relative Strength Index (RSI): Measures the speed and change of price movements.
- MACD (Moving Average Convergence Divergence): Shows the relationship between two moving averages.
How to Read a Forex Chart: Step-by-Step
- Choose Your Chart Type: Start with a chart type that you find easy to understand. Beginners may prefer line charts, while experienced traders might opt for candlestick charts.
- Set Your Timeframe: Select a timeframe that aligns with your trading strategy. Short-term traders may use lower timeframes, while long-term traders should focus on higher timeframes.
- Identify Trends: Look for patterns and trends in the chart. Use trendlines to connect the highs and lows and identify the direction of the market.
- Apply Technical Indicators: Add indicators like moving averages, RSI, and MACD to your chart to gain deeper insights into market dynamics.
- Mark Support and Resistance Levels: Draw horizontal lines at key support and resistance levels to anticipate potential reversal points.
- Analyze Market Sentiment: Pay attention to candlestick patterns and formations to gauge market sentiment. Patterns like Doji, Hammer, and Engulfing can provide valuable clues.
Summary
Reading Forex charts is an essential skill for any trader. By understanding different chart types, timeframes, support and resistance levels, and technical indicators, you can make more informed trading decisions. Practice regularly and refine your chart-reading skills to enhance your trading performance.
Keywords: Forex charts, read Forex charts, types of Forex charts, line charts, bar charts, candlestick charts, support and resistance, technical indicators, Forex trading strategies.


Post a Comment